Telling a graphic story
By Surender Gnanaolivu | November 17, 2017
VM&RD took a close look at the 19 of the top in-store graphics suppliers in India. The interaction with them reveals that they have been very busy in supplying, as per our estimate, over a million square feet of graphics annually for the organized retail sector.
 The organized Indian retail industry is at about US$ $ 60 Billion (source: India Brand Equity Foundation) and growing at about 20% CAGR. Considering the average spend on visual merchandising by companies is about 0.1% of revenues and 30% of that is spent on in-store signage, the annual market size estimate of In-store graphics is about US$ 18 Million.
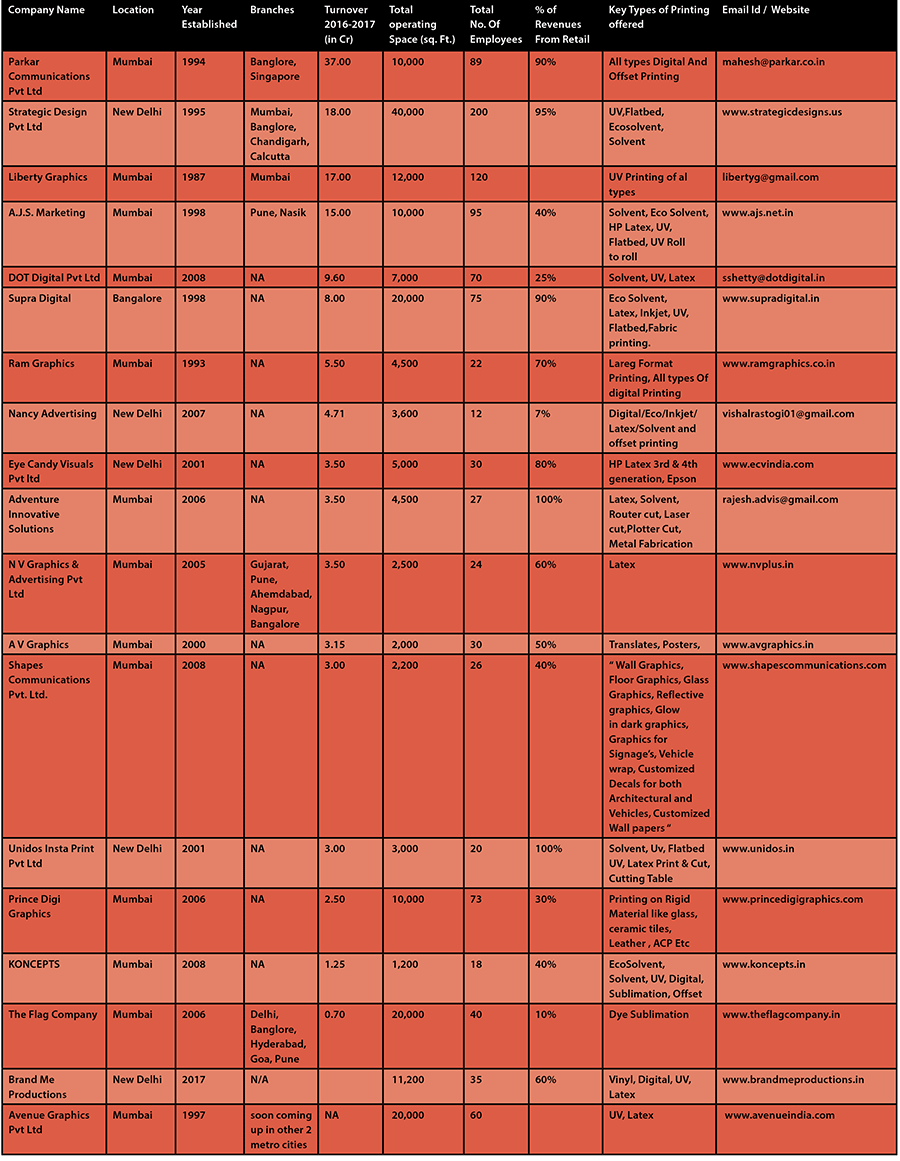
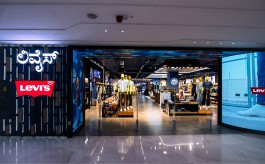
In-store graphics play a crucial role in creating compelling experiences for customers to convert them to buyers from browsers. Their core purpose is to deliver branding, create imagery and communicate brand and product information to complete the customer’s experience in the store environment.
With automation and technology enabling low entry barriers in this domain, many new players have entered the field to take a piece of the market estimate.
VM&RD took a close look at the 19 of the top in-store graphics suppliers in India. The interaction with them reveals that they have been very busy in supplying, as per our estimate, over a million square feet of graphics annually for the organized retail sector. Some in-sights from the findings are as follows:
Industry Health Check
1. Despite the growth of the digital media, the in-store graphics industry has grown by an average of about 20% which is incidentally the grown rate of the organized retail sector.
2. Owing to the entry of new players who have been servicing other industries, the average retail contribution of the turnovers is about 60% now.
3. Though there are new entrants into the retail domain, the average age of operating companies is about 15 years. This means that majority of them are not dependent completely on retail to survive.
4. Only 5% of the players we spoke with serve retail exclusively and about 10-15% have a contribution of over 75% of their turnover exclusively for retail.
5. The total revenue generated from the top 19 players is over ₹ 140 Cr. The average of each is a low ₹ 8 Cr though the top players are over about 3 times that average.
Consumer service report
1. The top 19 vendors are spread across three metros in India namely, Delhi, Mumbai and Bangalore probably because of them being the top retail markets in India. Mumbai tops the count with about over 60% players being located there followed by New Delhi.
2. Compared to the VM&Props industry’s space manning density of 250 sft per person this industry has a higher rate of 160 sft per person owing to lower spaces and high production customization that needs manual intervention.
3. The top 19 players are servicing over 450 clients with an average of about 25 clients each with the top 3 players servicing a challenging 50+ Clients each annually!
4. Only about 0.75% of the revenues of the top 19 players is earned from General Trade.
5. Only about 50% of them serve the large organized retail corporates and the remaining serve the smaller retailers and brands in the marketplace.
In conclusion, it is evident that supply is still inadequate for the existing demand and hence there is lot more room for more players and growth of current ones. However, the market can get disrupted with the growing use of digital media. Players are left with looking at this situation seriously as a big threat to manager or a huge opportunity to grab.
